
Walk through the retail trading world and you will find no shortage of belief. Gurus with secrets, screenshots of wins, and systems that promise the moon. What you rarely find is evidence. Evidence-based trading is the quiet alternative. Instead of believing a strategy works, you test it, you grade the support behind it, and you measure the results honestly. It is how serious traders think, and it is exactly what the tools inside The Hub deliver.
Below are four of those tools, what each one does, how it keeps you honest, and how to reach it. One note up front, though: The Hub keeps growing, so this is what is here now, not a finished set. We are still building, and every tool has to earn its place by adding real educational value.
What Evidence-Based Trading Actually Means
The phrase sounds obvious, yet almost nobody in retail practises it. Evidence-based trading means three specific habits. First, you treat a strategy as a hypothesis, not a truth. Second, you ask how much evidence actually stands behind it, and you stay honest when the answer is “not much.” Third, you measure your own results in objective terms, rather than remembering the wins and forgetting the rest.
That mindset is not anti-technical or anti-instinct. Rather, it is a filter. Some market behaviours are genuinely well studied. Researchers have documented time-series momentum, for example, across dozens of markets, as in this peer-reviewed research. Many popular setups, on the other hand, have never been independently proven at all. The whole point is to know which is which, and to trade accordingly.
There is one more point worth making, though: evidence-based trading is not only about the past. Markets change, and a strategy that thrives in one regime can quietly stop working when conditions shift. So real evidence also means reading the market you are in now, not just what worked before. That is exactly why the learning tools cover market conditions and when a strategy struggles, and why they support your judgment rather than replace it. In the end, a backtest tells you whether an idea has had an edge; a thinking trader still has to decide whether today’s conditions fit.
The Glossary: Get the Language Right
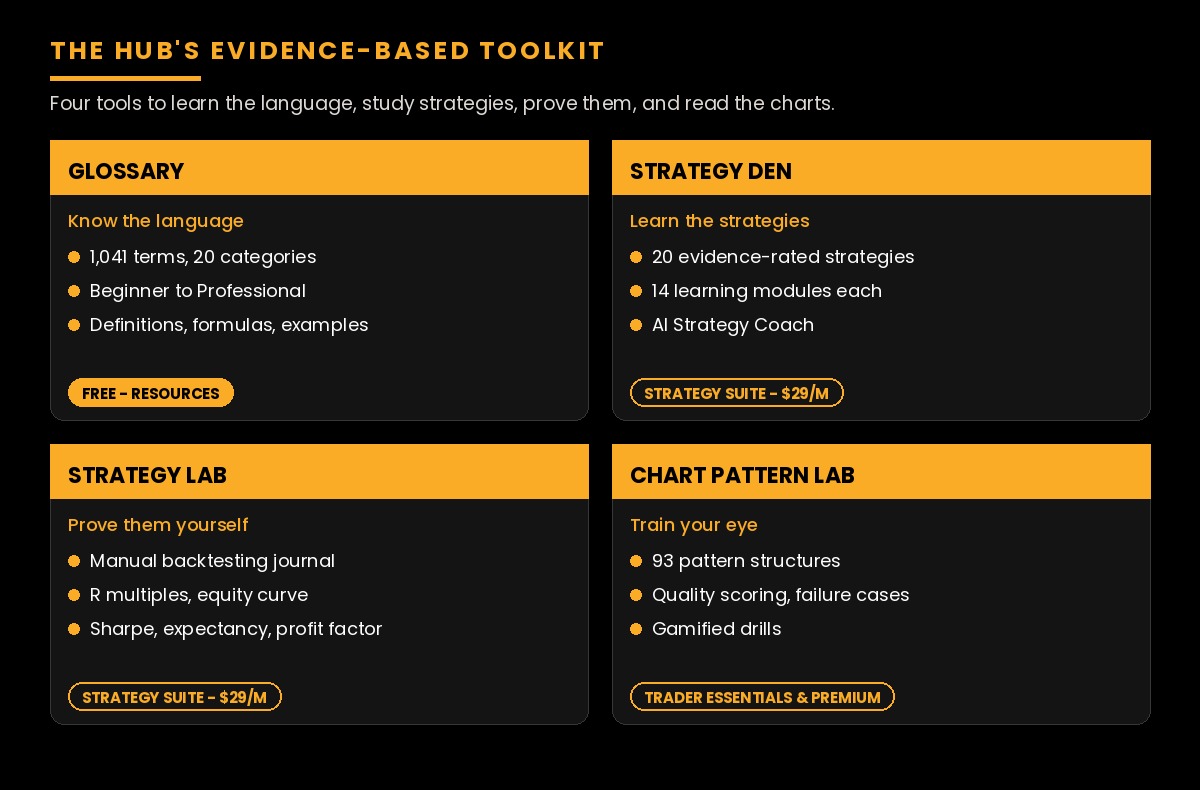
Precision starts with vocabulary, and sloppy language hides sloppy thinking. So the foundation is the Glossary, a reference of 1,041 trading and investing terms across 20 categories. Every term has a plain-English definition, and the deeper entries add a professional layer, why it matters, worked examples, formulas, and the common mistakes traders make. Better still, each entry carries a level from Beginner to Professional, so you can go as deep as you need. The Glossary is free, and you will find it under Resources in The Hub.
The Strategy Den: Strategies Graded by Evidence
This is where the rigour becomes visible. The Strategy Den teaches 20 strategies, from foundation methodologies to specific setups, and each one runs through 14 learning modules, a six-step visual walkthrough, a Test Your Eye exercise, and a knowledge test. Our full technical trading strategies content sits alongside it, and an educational AI Strategy Coach can explain any concept, though it never gives signals or advice.
Here is the part that will make a serious analyst look twice. Every strategy carries an honest evidence label: Research-Supported, Research-Informed, Strategy-Specific Testing Required, or SOT Historically Tested. In other words, we will openly tell you when a popular strategy is unproven, so you treat it as a hypothesis to test, never as a guaranteed edge. That is the opposite of hype, and it captures the Den’s philosophy: do not chase the perfect strategy, build the perfect understanding of your process. The Strategy Den is part of the Strategy Suite, a standalone add-on with a 7-day complimentary trial, then 29 US dollars a month.
The Strategy Lab: Prove It in R and Sharpe
A graded strategy is still just a claim until you test it yourself. So the Strategy Lab is a private, manual backtesting journal that runs on historical replay only. You step through past price, log each trade by hand, and the Lab builds your record in objective terms: R multiples, an equity curve, and institutional-grade analytics like win rate, profit factor, expectancy, Sharpe and Sortino ratios, System Quality Number, and Kelly percentage. We explored this in more depth in our guide to backtesting trading strategies. Importantly, everything stays in your own browser, and every metric is self-reported and hypothetical, not a verified result and not a performance record. The Lab is the other half of the Strategy Suite.
The Chart Pattern Lab: Study Why Structures Fail
Most pattern education shows you the textbook winners. This one does the opposite as well. The Chart Pattern Lab covers 93 structures, chart patterns, candlesticks, harmonics, and market structure, each with step-by-step builds, quality scoring, and, crucially, its failure cases. Then it drills you through gamified exercises like Spot the Pattern, Find the Pattern, and Pattern Sniper. Because studying how a structure fails teaches you more than admiring how it succeeds, it pairs naturally with the discipline side of trading psychology. Note that it builds all its charts as educational illustrations, not from live market data. The Chart Pattern Lab sits in the Trade- and Market Insights channel, included with the Trader Essentials and Premium Performance Tracker tiers.
Evidence-Based Trading, Not Hype: How It Fits Together
Look at the four together and the through-line is clear. The Glossary makes your language precise. The Strategy Den grades what you learn by real evidence. The Strategy Lab makes you prove it in numbers. The Chart Pattern Lab trains your eye on both success and failure. At no point do we ask you to take anything on faith.
Ultimately, that is what evidence-based trading looks like in practice, and it is deliberately unglamorous. There are no secrets here, no guaranteed systems, and no promises. Instead, there is a set of tools that reward honesty and punish wishful thinking. And because we keep building, the toolkit will keep expanding around that same principle.
The simplest place to start is the free Glossary. Join The Hub at no cost, get the language right, then explore the tools that grade, prove, and sharpen everything else.
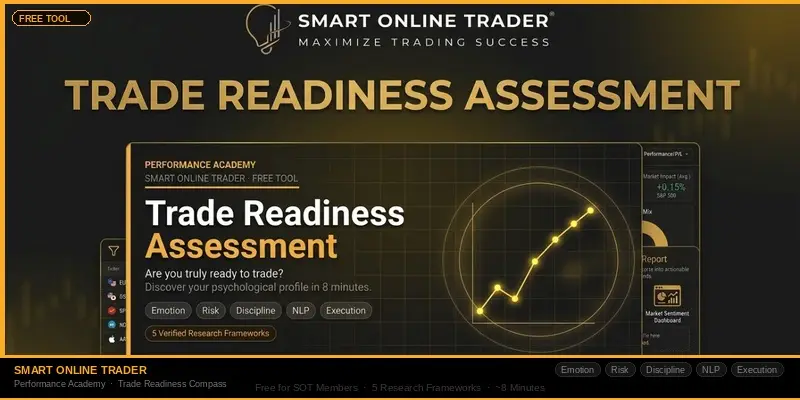
Join The Hub, free
Explore the free resources, tools and Trade Journal, and start with the free Glossary.
Download the Smart Online Trader App
Android / Play Store
iOS / App Store
The Rewards Rebate Programme: Months 7 and 13
Here is what makes the SOT system more than an education. Stay the course, and the programme rewards your commitment at two clear milestones.
REAL REWARDS
The Rewards Rebate Programme
“What you invest to learn becomes what you trade with.”
Month 7
A simulated $5,000 Prop Firm Evaluation activates, included with your membership. So your training meets its first real test.
Month 13
Your membership value returns to you as credit in a Simulated Funded Account, with a 50/50 split on the profits you generate.
Simulated environment throughout. Effective 1 June 2026 and subject to the Rewards Rebate Programme terms.
Frequently Asked Questions
What is evidence-based trading?
Evidence-based trading means treating a strategy as a hypothesis, judging how much real evidence supports it, and measuring your own results objectively rather than relying on belief or memory. It favours testing and honest metrics over secrets and promises.
What are the evidence classifications in the Strategy Den?
We label every strategy Research-Supported, Research-Informed, Strategy-Specific Testing Required, or SOT Historically Tested. So the labels tell you honestly how much support stands behind a strategy, including when it is unproven, so you treat it as a hypothesis to test.
Is the Glossary free?
Yes. The Glossary is free and lives under Resources in The Hub. It covers 1,041 terms across 20 categories, leveled from Beginner to Professional.
How do I access the Strategy Suite and the Chart Pattern Lab?
The Strategy Suite, which contains the Strategy Den and Strategy Lab, is a standalone add-on with a 7-day complimentary trial, then 29 US dollars a month. The Chart Pattern Lab sits in the Trade- and Market Insights channel, included with the Trader Essentials and Premium Performance Tracker tiers.
Does the Strategy Lab use live market data?
No. The Strategy Lab is historical replay only, with no live data, no broker connection, and no signals. Its metrics are self-reported and hypothetical, not verified trading results and not a performance record.
Are the Chart Pattern Lab charts real market data?
No. The Chart Pattern Lab builds all its charts as educational illustrations, not from live or historical market data. So any probability figures are educational measurements on that constructed data, not live market statistics.
Where do I start?
Start with the free Glossary. Join The Hub at no cost, get comfortable with the language, then explore the Strategy Suite and the Chart Pattern Lab as your skills grow.
Smart Online Trader and its employees are not licensed Financial Services Providers (FSPs). This content is for educational purposes only and does not constitute financial or investment advice. The Strategy Lab is historical replay only and the Chart Pattern Lab uses constructed educational data; all metrics and figures are hypothetical and are not verified results or a performance record. Historical performance does not guarantee future results, and all trading carries the risk of loss. Always consult an authorised FSP before making any trading or investment decisions. See our full risk warning and disclaimer.
